Adding Metrics
The Metrics tab is your go-to space for tracking all the key performance indicators (KPIs) and model performance metrics related to your AI project. Turo makes it easy to bring in data using two methods:
- Turo APIs – Built on top of the open-source OpenTelemetry APIs, this method is perfect for pushing data from any system or workload into Turo.
- MLflow Integration – Seamlessly ingest model performance metrics directly from MLflow.
Let’s dive into how each method works!
Using Turo APIs
This method allows you to push data points to Turo via an API. Turo expects a time-series data, with no specific cadance. Here’s how to get started:
- Navigate to the “Metrics” tab and click on “Connections” in the top-right corner.
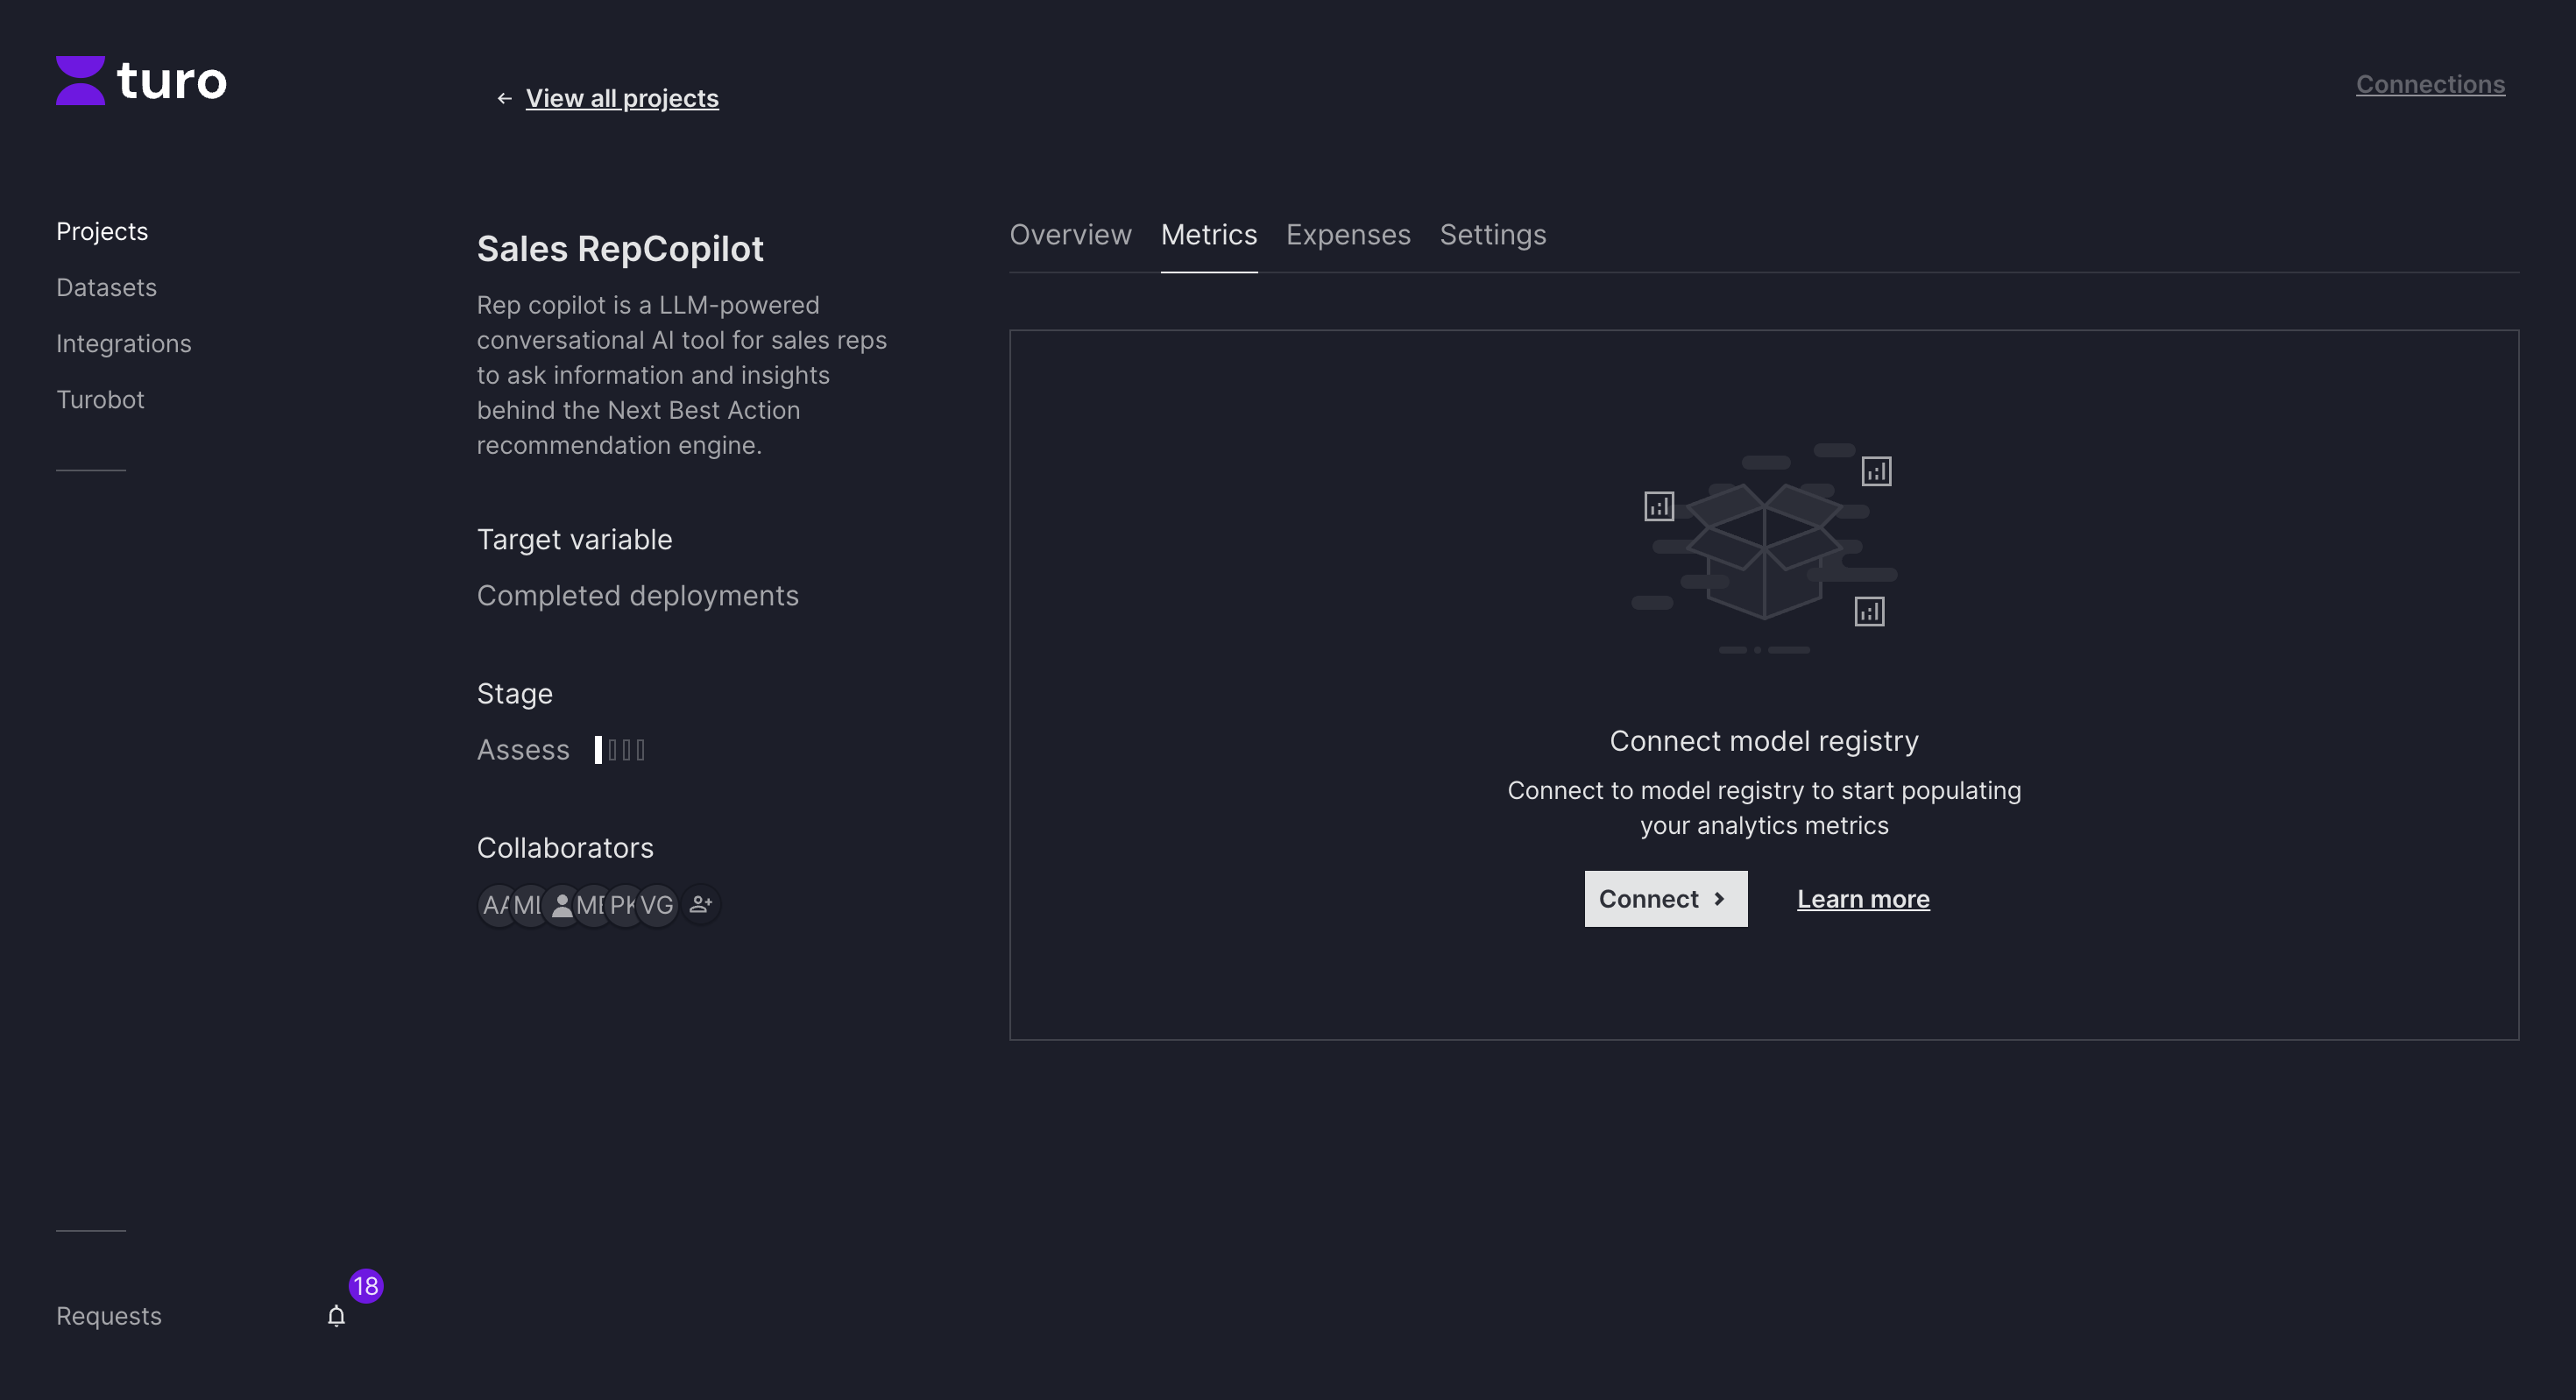
- Click “Add a Connection”
- Choose who will add the metric. For this flow, select “Myself” (Choosing "Someone else" will open a form to send a request to a colleague to push a metric)
- Add a name for your connection.
- Select “OpenTelemetry Endpoint”
- Decide where the metric will appear on the metrics tab:
- Choose “Business (Key Performance Indicator)” if you’re pushing a business KPI.
- Choose ��“Model Performance” if you’re pushing a model performance metric.
- Click “Continue” where you can see a summary.
- Finish the wizard.
You’ll see an API endpoint and a key—keep these handy! You’ll need them to push data to Turo.
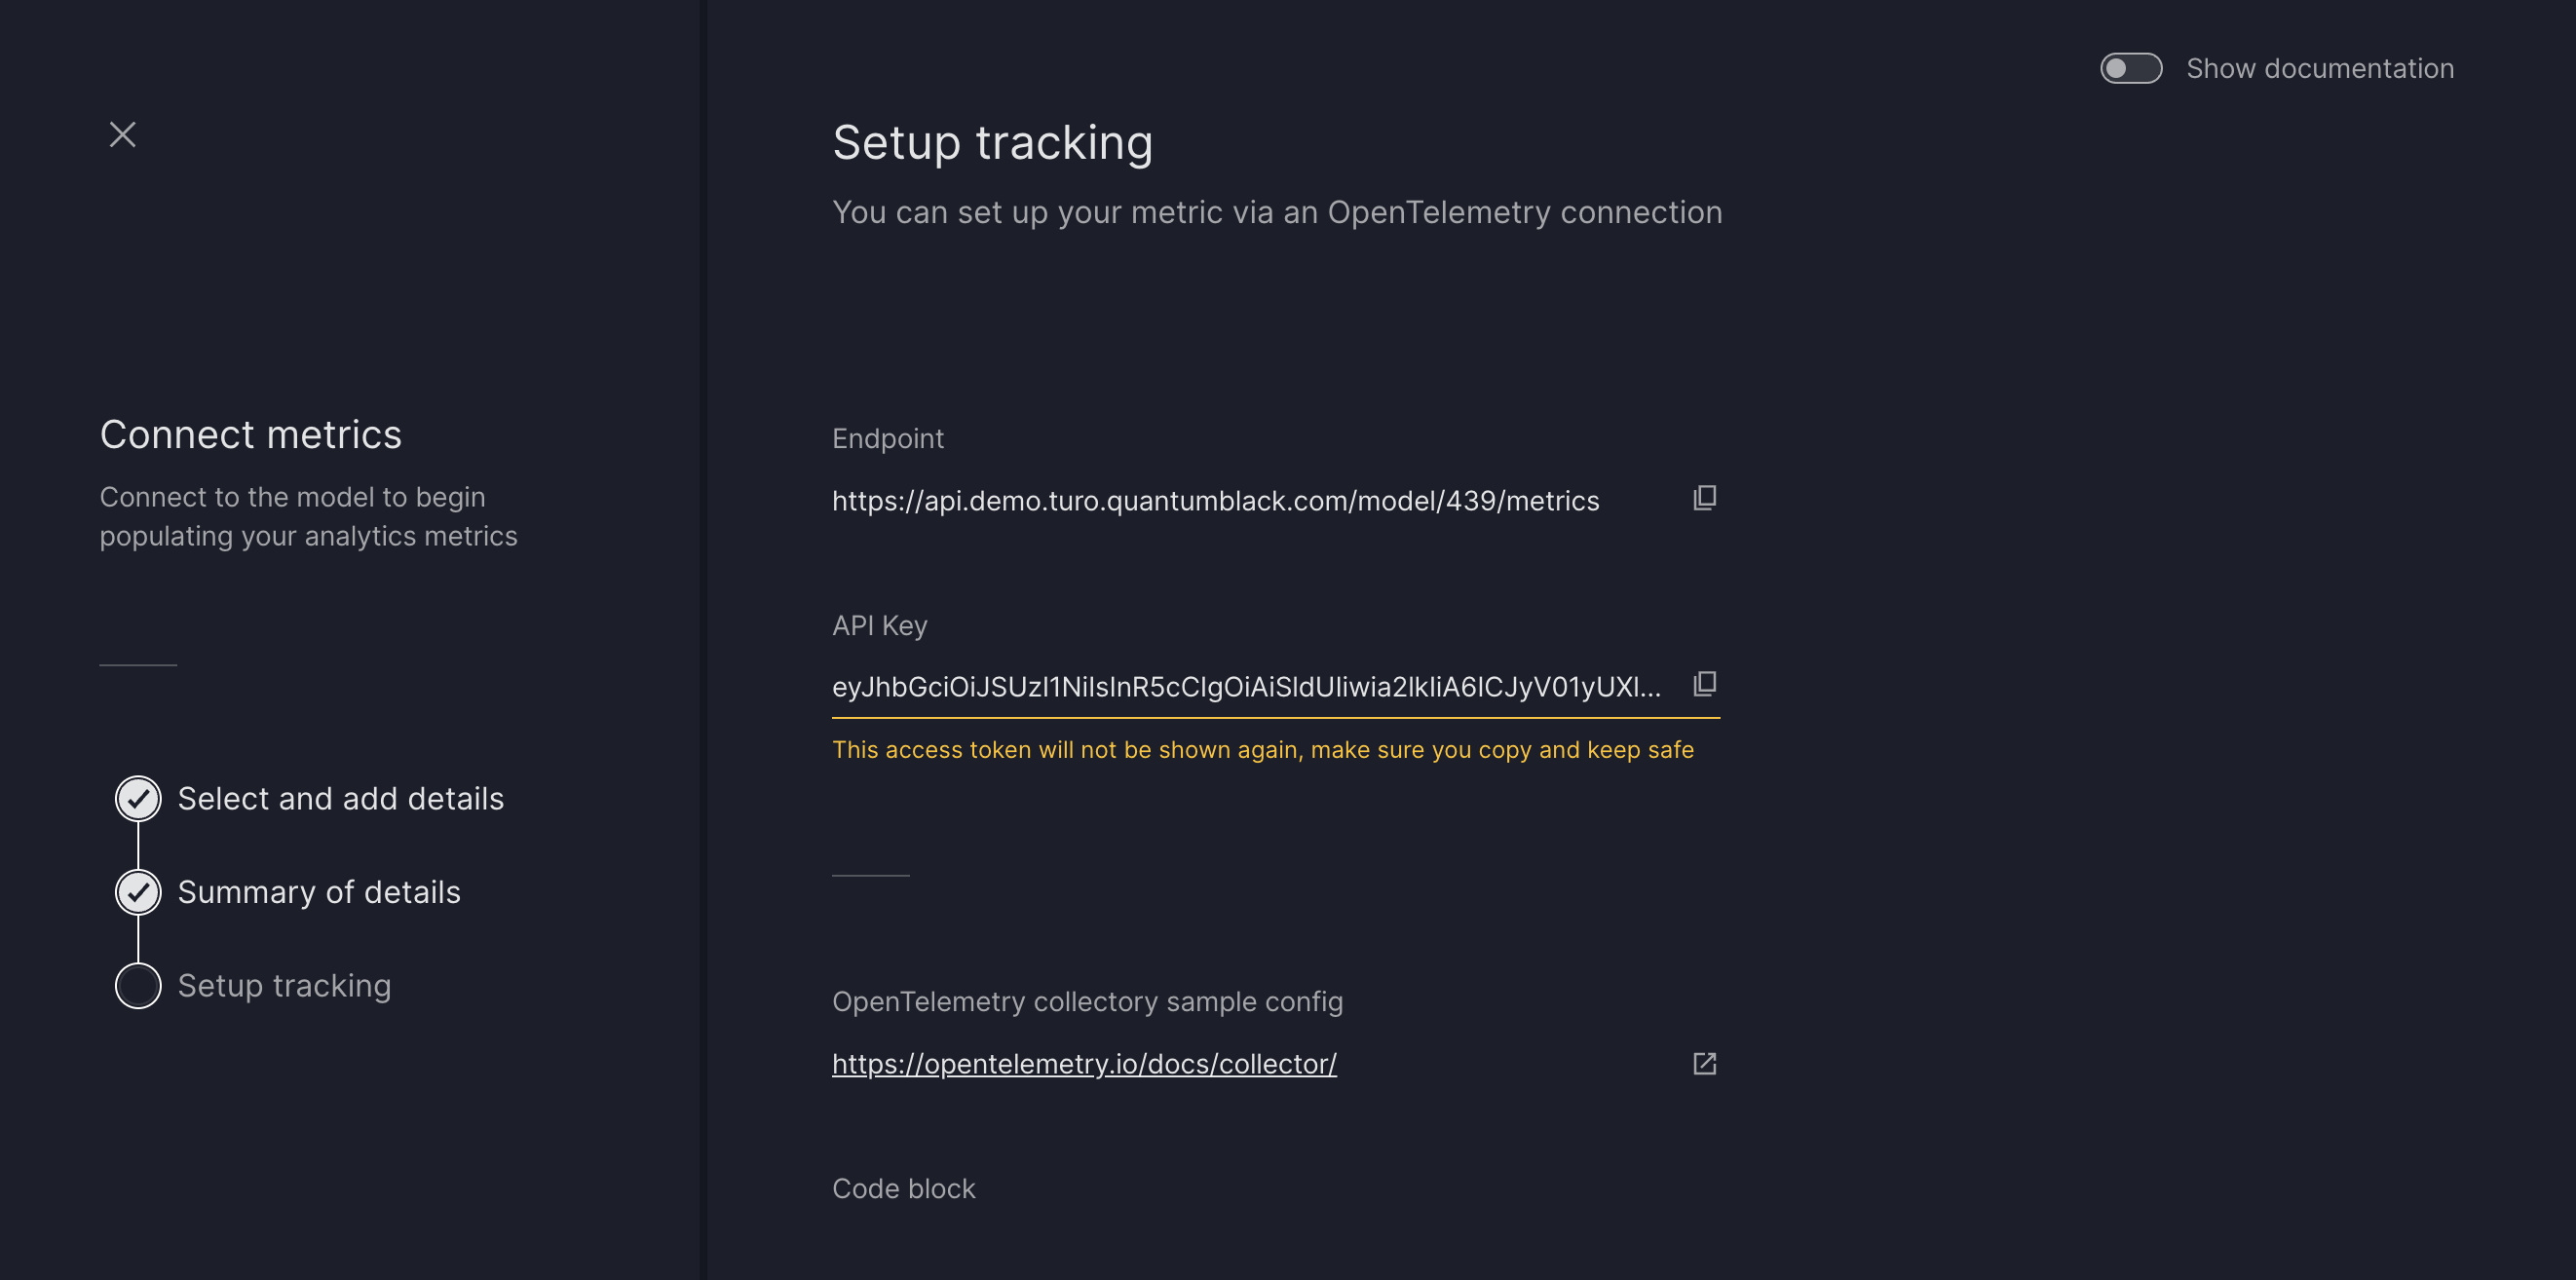
Now you can use the API endpoint to push data Turo, either using HTTP requests or using the openTelemetery SDK
A Few Things to Note:
- You can generate a new API key anytime by opening the Connections panel, expanding the connection, and clicking “Generate New API Key.”
- Data points cannot be deleted once pushed. If you need assistance, reach out to the Turo team.
Connecting MLflow
If your model is hosted on MLflow, you can easily register it with Turo. Here’s how:
- Make sure you have the following information:
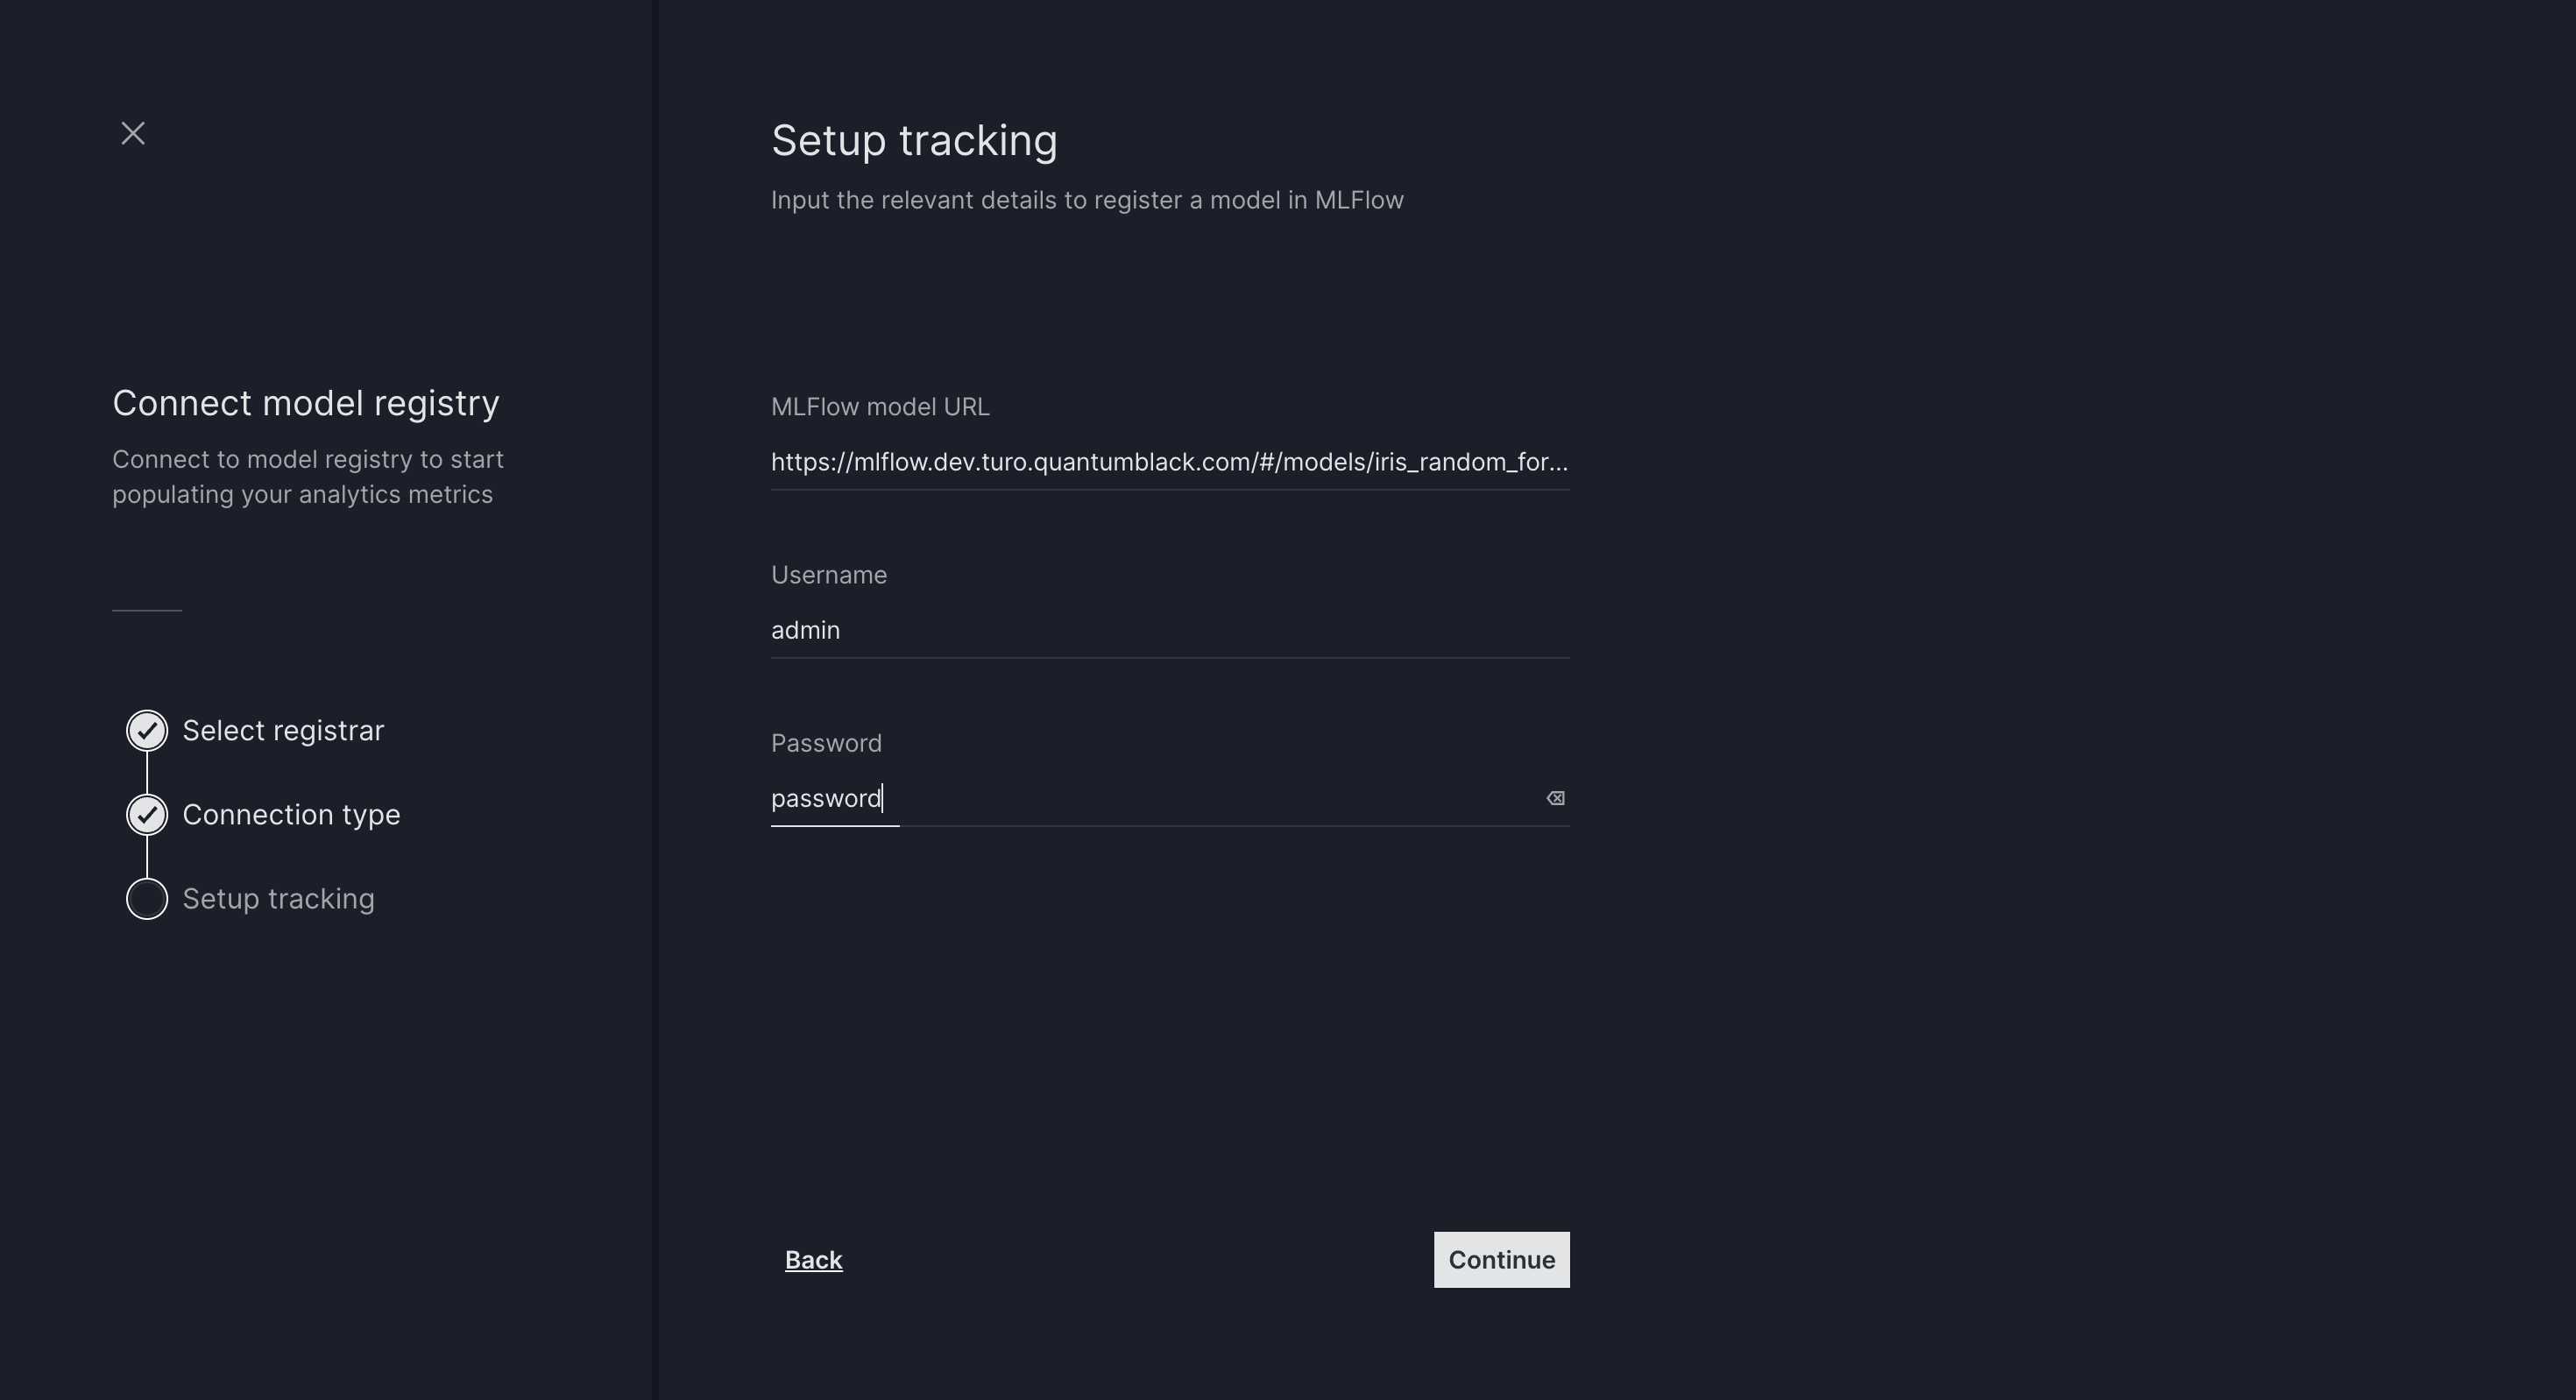
- MLflow Model URL – The URL where your MLflow model is hosted.
- MLflow HTTP Authentication Credentials – The credentials required to access your MLflow instance.
- Follow the same steps as “Using Turo APIs,” but select “MLflow” instead of “OpenTelemetry Endpoint.”
- Enter the MLflow details from Step 1 into the form and submit.
Once registered, you’ll see a confirmation message letting you know the model has been successfully added.
Note: Turo automatically picks up models tagged with the “production” tag in the provided Model URL and displays all associated metrics by default.
Metrics Features
Turo’s Metrics tab provides 3 main features to help you stay on top of your project’s KPIs. Here’s what you can do:
Set Alerts
Admins and Project Editors can set alerts for each metric to get notified if new data points go out of bounds. This allows you to act quickly and keep your project on track.
To add an alert:
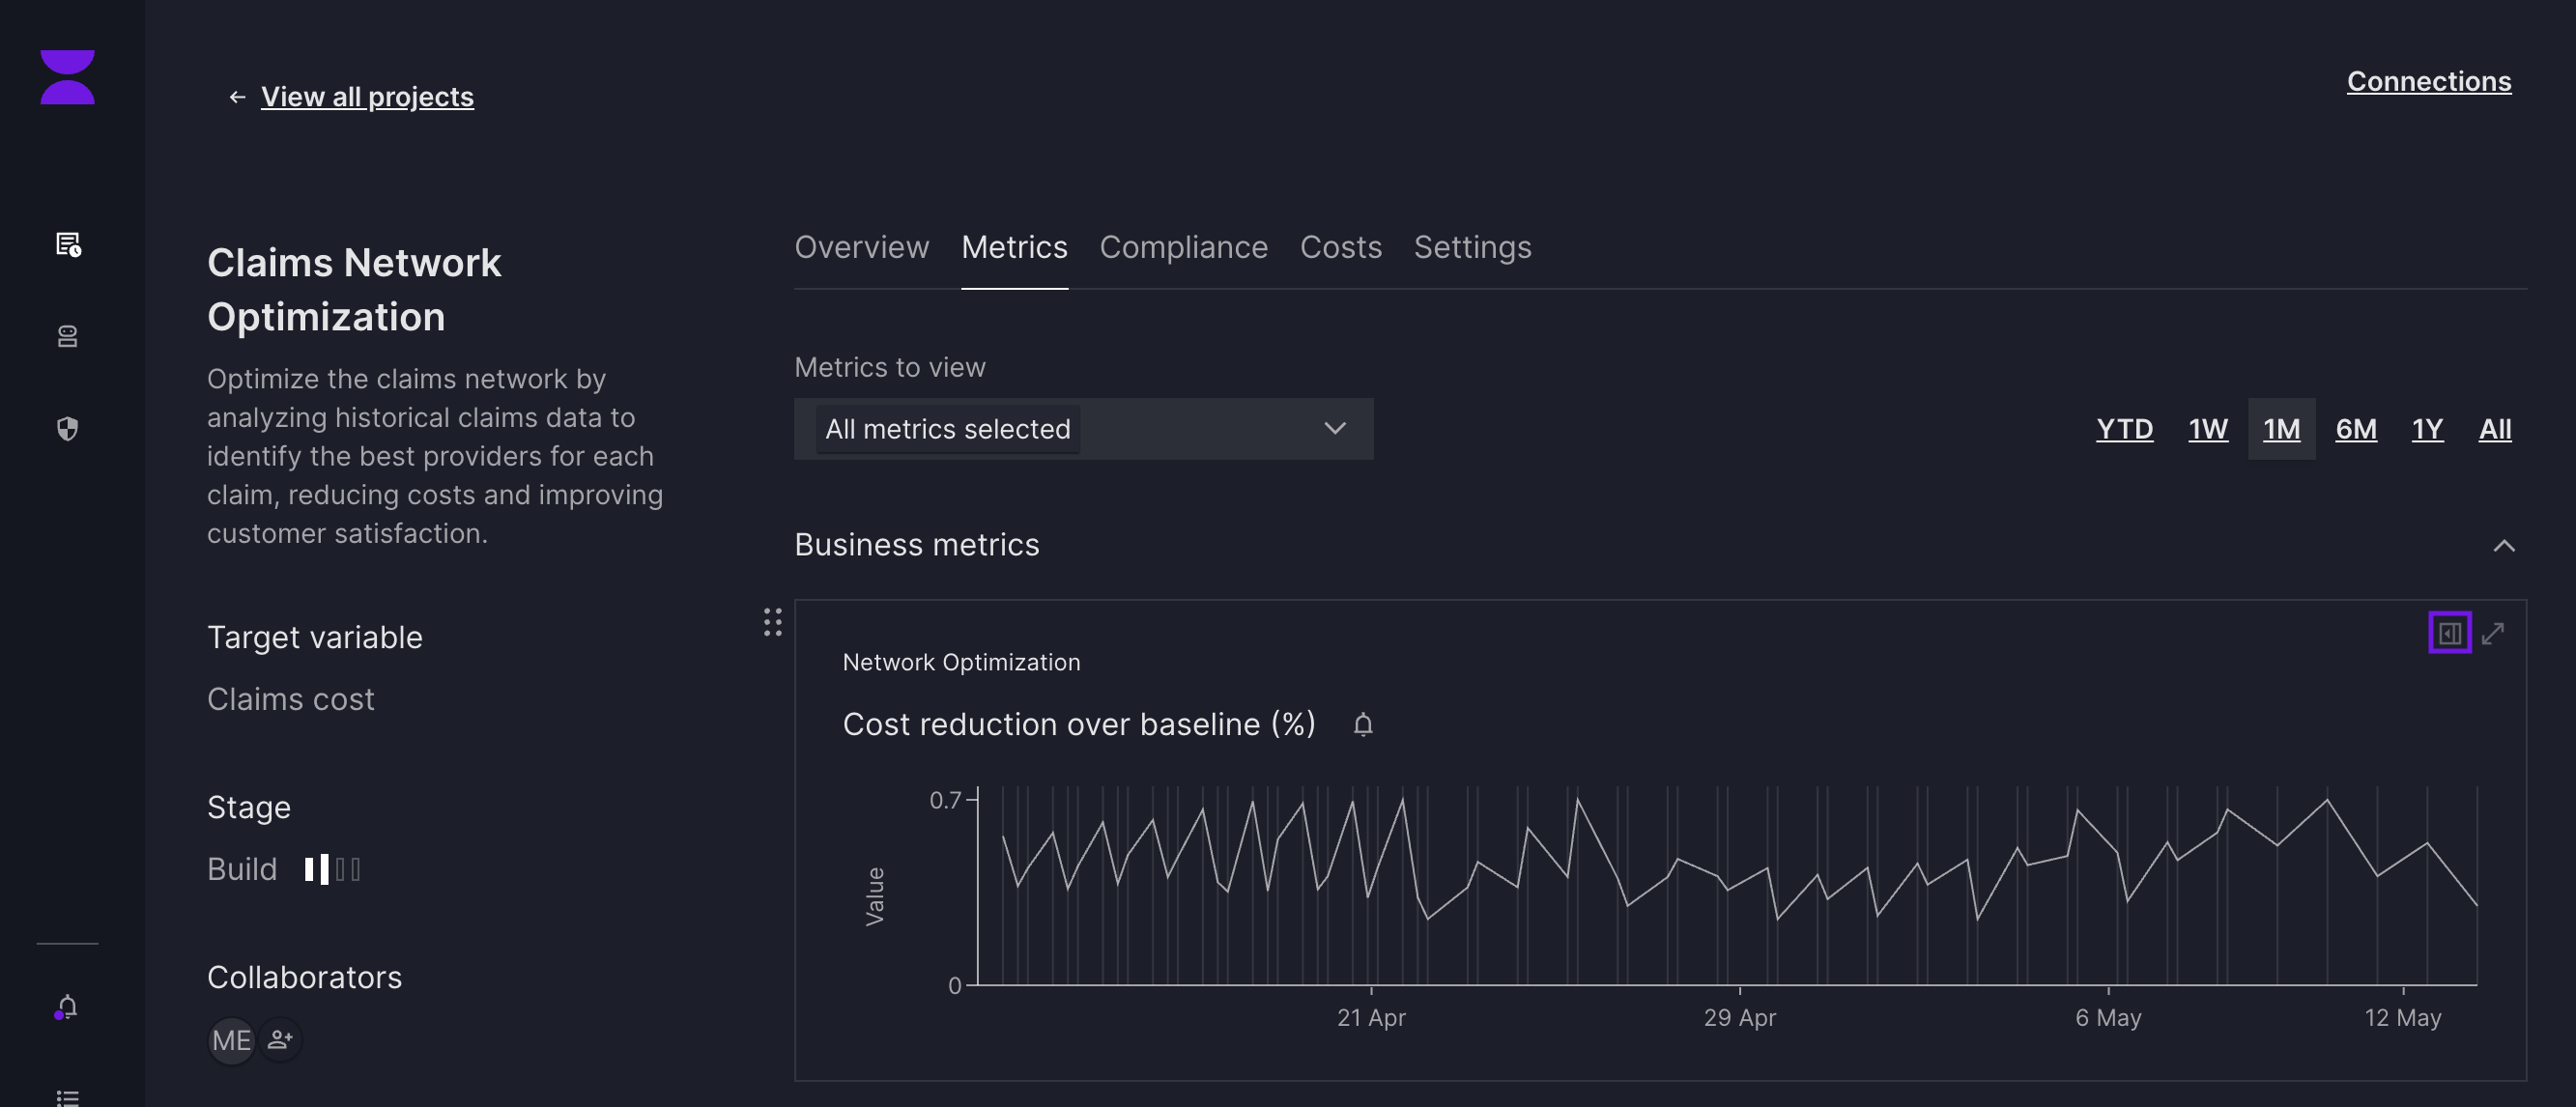
- Navigate to the metric of your choice.
- Click on the “Bell” icon.
![]()
Note: Alerts are user-specific, meaning only the user who sets an alert will see it or receive notifications when it’s triggered.
You can create as many alerts as you need! There are two types of alerts:
- Min/Max Alert: Triggered when a new value falls below the minimum or exceeds the maximum threshold. You can specify either or both thresholds for a single alert.
- Percentage Change Alert: Triggered when a new value changes by more or less than a defined percentage compared to the last registered value.
Important: The percentage change alert uses the last registered value for the metric at the time of creating the alert as the reference point.
Reorder Metrics
Turo lets you reorder them with a simple drag-and-drop feature to prioritise which metrics to see first
- Click the drag button next to a metric.

- Move it to your desired position.
Note:
- Metrics can only be reordered within their respective sections (e.g., Business KPIs or Model Performance).
- The order is project-specific, meaning that the same order will appear to all users
Add Metadata to Metrics
Give your metrics more context by adding metadata. Here’s how:
- Click on the “Metadata Panel” button for the metric you want to update.
- Add the following details:
- Desired Direction: Specify whether the metric should increase (e.g., number of users) or decrease (e.g., number of complaints). This helps Turo provide a clearer picture of your project’s performance.
- Description: Add a brief explanation of the metric, including where it’s being ingested from and any other critical details.